Note
Go to the end to download the full example code
Identifying and estimating time shifts#
Identifying time shifts from clock errors or uncorrected Daylight Saving Time.
Time shifts can occur in measured data due to clock errors and time zone issues (for example, assuming a dataset is in local standard time when in fact it contains Daylight Saving Time).
This example uses shifts_ruptures()
to identify abrupt time shifts in a time series, and estimate the
corresponding time shift amount.
import pvlib
import pandas as pd
from pvanalytics.quality.time import shifts_ruptures
from pvanalytics.features.daytime import (power_or_irradiance,
                                          get_sunrise, get_sunset)
import matplotlib.pyplot as plt
Typically this process would be applied to measured data with possibly untrustworthy timestamps. However, for instructional purposes here, we’ll create an artificial example dataset that contains a time shift due to DST.
# use a time zone (US/Eastern) that is affected by DST.
# Etc/GMT+5 is the corresponding local standard time zone.
times = pd.date_range('2019-01-01', '2019-12-31', freq='5T', tz='US/Eastern')
location = pvlib.location.Location(40, -80)
cs = location.get_clearsky(times)
measured_signal = cs['ghi']
The shifts_ruptures() function
is centered around comparing the timing of events observed in the measured
data with expected timings for those same events.
In this case, we’ll use the timing of solar noon as the event.
First, we’ll extract the timing of solar noon from the measured data.
This could be done in several ways; here we will just take the midpoint
between sunrise and sunset using times estimated with
power_or_irradiance().
is_daytime = power_or_irradiance(measured_signal)
sunrise_timestamps = get_sunrise(is_daytime)
sunrise_timestamps = sunrise_timestamps.resample('d').first().dropna()
sunset_timestamps = get_sunset(is_daytime)
sunset_timestamps = sunset_timestamps.resample('d').first().dropna()


def ts_to_minutes(ts):
    # convert timestamps to minutes since midnight
    return ts.dt.hour * 60 + ts.dt.minute + ts.dt.second / 60


midday_minutes = (
    ts_to_minutes(sunrise_timestamps) + ts_to_minutes(sunset_timestamps)
) / 2
Now, calculate the expected timing of solar noon at this location for each day. Note that we use a time zone without DST for calculating the expected timings; this means that if the “measured” data does include DST in its timestamps, it will be flagged as a time shift.
dates = midday_minutes.index.tz_localize(None).tz_localize('Etc/GMT+5')
sp = location.get_sun_rise_set_transit(dates, method='spa')
transit_minutes = ts_to_minutes(sp['transit'])
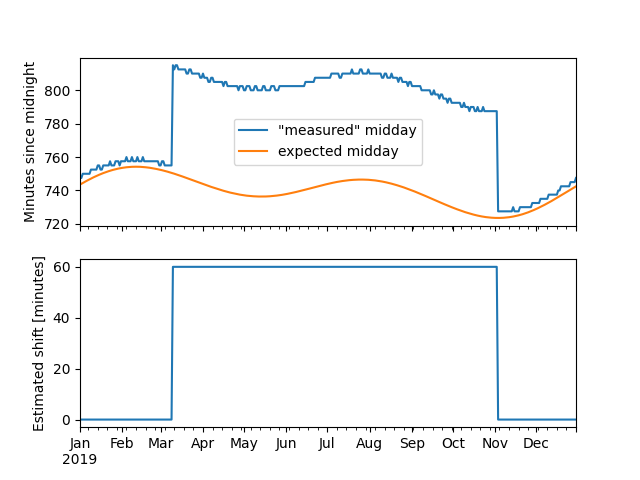
Finally, ask ruptures if it sees any change points in the difference between these two daily event timings, and visualize the result:
is_shifted, shift_amount = shifts_ruptures(midday_minutes, transit_minutes)

fig, axes = plt.subplots(2, 1, sharex=True)

midday_minutes.plot(ax=axes[0], label='"measured" midday')
transit_minutes.plot(ax=axes[0], label='expected midday')
axes[0].set_ylabel('Minutes since midnight')
axes[0].legend()

shift_amount.plot(ax=axes[1])
axes[1].set_ylabel('Estimated shift [minutes]')
Text(47.097222222222214, 0.5, 'Estimated shift [minutes]')
Total running time of the script: (0 minutes 2.164 seconds)