Note
Go to the end to download the full example code
Weather Limits#
Identifying weather values that are within limits.
Identifying weather values that are within logical, expected limits
and filtering data outside of these limits allows for more accurate
future data analysis.
In this example, we demonstrate how to use
pvanalytics.quality.weather.wind_limits(),
pvanalytics.quality.weather.temperature_limits(),
and pvanalytics.quality.weather.relative_humidity_limits()
to identify and filter out values that are not within expected limits,
for wind speed, ambient temperature, and relative humidity, respectively.
import pvanalytics
from pvanalytics.quality.weather import wind_limits, \
    temperature_limits, relative_humidity_limits
import matplotlib.pyplot as plt
import pandas as pd
import pathlib
First, we read in the NREL RMIS weather station example, which contains wind speed, temperature, and relative humidity data in m/s, deg C, and % respectively. This data set contains 5-minute right-aligned measurements.
pvanalytics_dir = pathlib.Path(pvanalytics.__file__).parent
rmis_file = pvanalytics_dir / 'data' / 'rmis_weather_data.csv'
data = pd.read_csv(rmis_file, index_col=0, parse_dates=True)
print(data.head(10))
                     Ambient Temperature  ...  Wind Speed
2022-01-01 00:05:00            -10.59725  ...    1.930175
2022-01-01 00:10:00            -10.63128  ...    2.167881
2022-01-01 00:15:00            -10.66532  ...    0.827218
2022-01-01 00:20:00            -10.71636  ...    0.608528
2022-01-01 00:25:00            -10.66532  ...    1.036399
2022-01-01 00:30:00            -10.81846  ...    1.150498
2022-01-01 00:35:00            -10.78443  ...    1.958699
2022-01-01 00:40:00            -10.86950  ...    0.941317
2022-01-01 00:45:00            -10.88652  ...    1.511812
2022-01-01 00:50:00            -10.85249  ...    0.047541

[10 rows x 12 columns]
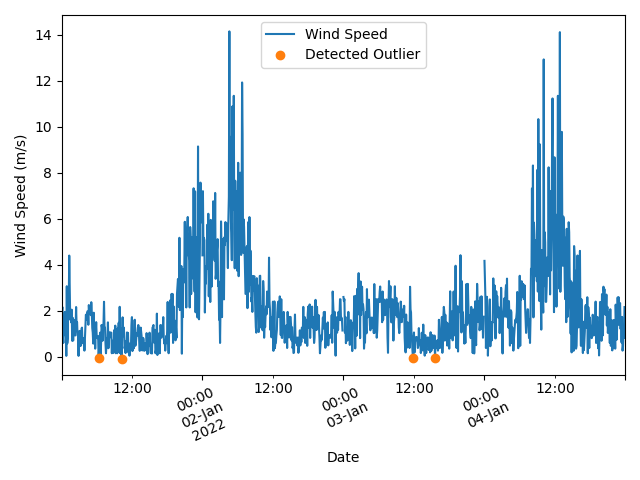
First, we use pvanalytics.quality.weather.wind_limits()
to identify any wind speed values that are not within an
acceptable range. We can then filter any of these values out of the
time series.
wind_limit_mask = wind_limits(data['Wind Speed'])
data['Wind Speed'].plot()
data.loc[~wind_limit_mask, 'Wind Speed'].plot(ls='', marker='o')
plt.legend(labels=["Wind Speed", "Detected Outlier"])
plt.xlabel("Date")
plt.ylabel("Wind Speed (m/s)")
plt.xticks(rotation=25)
plt.tight_layout()
plt.show()
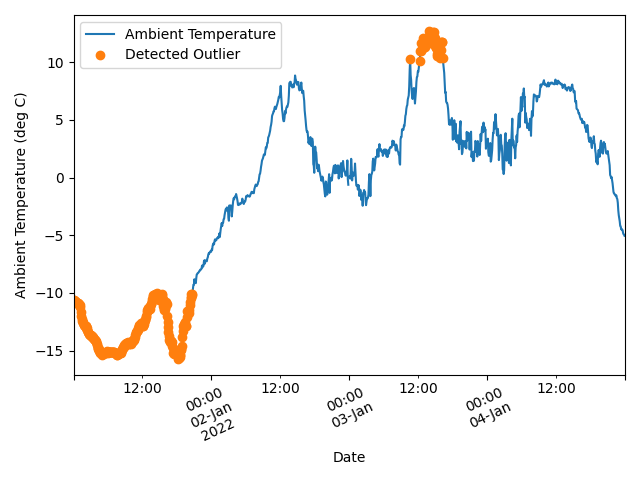
Next, we use pvanalytics.quality.weather.temperature_limits()
to identify any air temperature values that are not within an
acceptable range. We can then filter any of these values out of the time
series. Here, we set the temperature limits to (-10,10), illustrating how
to use the limits parameter.
temperature_limit_mask = temperature_limits(data['Ambient Temperature'],
                                            limits=(-10, 10))
data['Ambient Temperature'].plot()
data.loc[~temperature_limit_mask, 'Ambient Temperature'].plot(ls='',
                                                              marker='o')
plt.legend(labels=["Ambient Temperature", "Detected Outlier"])
plt.xlabel("Date")
plt.ylabel("Ambient Temperature (deg C)")
plt.xticks(rotation=25)
plt.tight_layout()
plt.show()
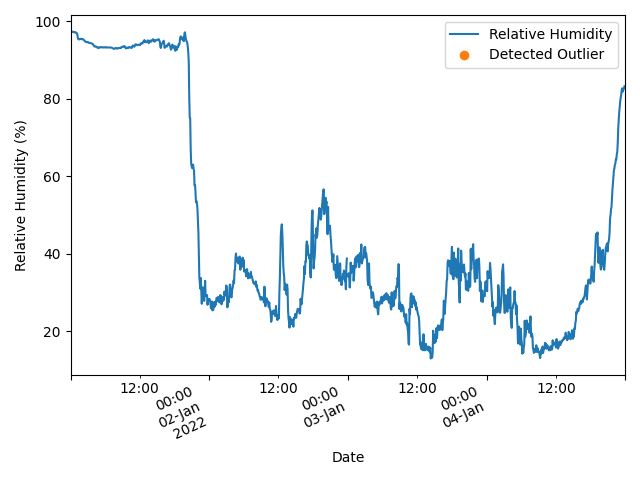
Finally, we use
pvanalytics.quality.weather.relative_humidity_limits()
to identify any RH values that are not within an
acceptable range. We can then filter any of these values out of the time
series.
rh_limit_mask = relative_humidity_limits(data['Relative Humidity'])
data['Relative Humidity'].plot()
data.loc[~rh_limit_mask, 'Relative Humidity'].plot(ls='', marker='o')
plt.legend(labels=['Relative Humidity', "Detected Outlier"])
plt.xlabel("Date")
plt.ylabel('Relative Humidity (%)')
plt.xticks(rotation=25)
plt.tight_layout()
plt.show()
Total running time of the script: (0 minutes 0.756 seconds)