Note
Go to the end to download the full example code
Calculate Variability Index#
Calculate the Variability Index for a GHI time series.
Highly variable irradiance can cause mismatch between irradiance and power measurements and result in noisy performance metrics. As such, identifying and removing highly variable conditions is useful in certain analyses. Identification and quantification of highly variable conditions are also of interest in grid integration and hourly modeling error contexts. The variability index (VI) is one way of quantifying the variability or jaggedness of an irradiance signal relative to a corresponding reference clear-sky irradiance profile. Note that quantifying variability is related to but distinct from clear-sky detection. For example, both clear and overcast skies have low VI. This example uses GHI data collected from the NREL RMIS system to calculate the variability index as a time series.
import pvanalytics
from pvanalytics.metrics import variability_index
import matplotlib.pyplot as plt
import pandas as pd
import pathlib
import pvlib
First, read in data from the RMIS NREL system. This data set contains 5-minute right-aligned POA, GHI, DNI, DHI, and GNI measurements, but only the GHI is relevant here.
pvanalytics_dir = pathlib.Path(pvanalytics.__file__).parent
rmis_file = pvanalytics_dir / 'data' / 'irradiance_RMIS_NREL.csv'
data = pd.read_csv(rmis_file, index_col=0, parse_dates=True)
# Make the datetime index tz-aware.
data.index = data.index.tz_localize("Etc/GMT+7")
Now model clear-sky irradiance for the location and times of the
measured data. You can do this using
pvlib.location.Location.get_clearsky(), using the lat-long
coordinates associated the RMIS NREL system.
location = pvlib.location.Location(39.7407, -105.1686)
clearsky = location.get_clearsky(data.index)
Calculate the variability index for the system GHI data stream using
the pvanalytics.metrics.variability_index() function, using
an hourly frequency.
variability_index_series = variability_index(data['irradiance_ghi__7981'],
                                             clearsky['ghi'],
                                             freq='1h')
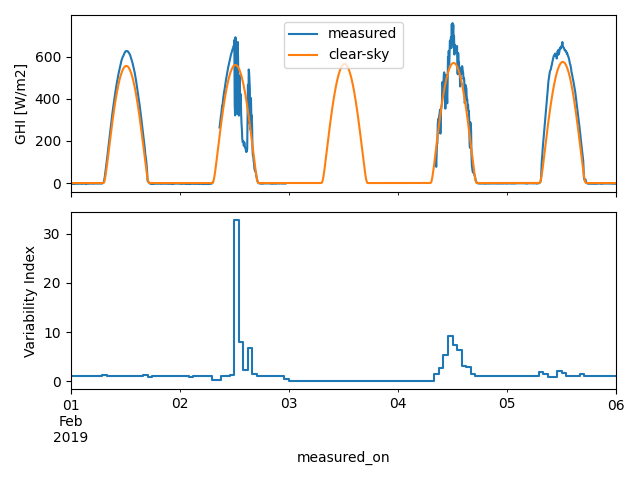
Plot the calculated VI against the underlying GHI measurements, for the purpose of comparison.
fig, axes = plt.subplots(2, 1, sharex=True)
data['irradiance_ghi__7981'].plot(ax=axes[0], label='measured')
clearsky['ghi'].plot(ax=axes[0], label='clear-sky')
variability_index_series.plot(ax=axes[1], drawstyle='steps-post')
axes[0].legend()
axes[0].set_ylabel("GHI [W/m2]")
axes[1].set_ylabel("Variability Index")
fig.tight_layout()
plt.show()
Total running time of the script: (0 minutes 0.447 seconds)