Note
Go to the end to download the full example code
Infer Array Tilt/Azimuth - PVWatts Method#
Infer the azimuth and tilt of a system using PVWatts-based methods
Identifing and/or validating the azimuth and tilt information for a
system is important, as these values must be correct for degradation
and system yield analysis. This example shows how to use
pvanalytics.system.infer_orientation_fit_pvwatts() to estimate
a fixed-tilt system’s azimuth and tilt, using the system’s known
latitude-longitude coordinates and an associated AC power time series.
import pvanalytics
import matplotlib.pyplot as plt
from pvanalytics import system
import pandas as pd
import pathlib
import pvlib
First, we import an AC power data stream from the SERF East site located at NREL. This data set is publicly available via the PVDAQ database in the DOE Open Energy Data Initiative (OEDI) (https://data.openei.org/submissions/4568), under system ID 50. This data is timezone-localized.
pvanalytics_dir = pathlib.Path(pvanalytics.__file__).parent
ac_power_file = pvanalytics_dir / 'data' / 'serf_east_15min_ac_power.csv'
data = pd.read_csv(ac_power_file, index_col=0, parse_dates=True)
data = data.sort_index()
time_series = data['ac_power']
time_series = time_series.asfreq('15min')

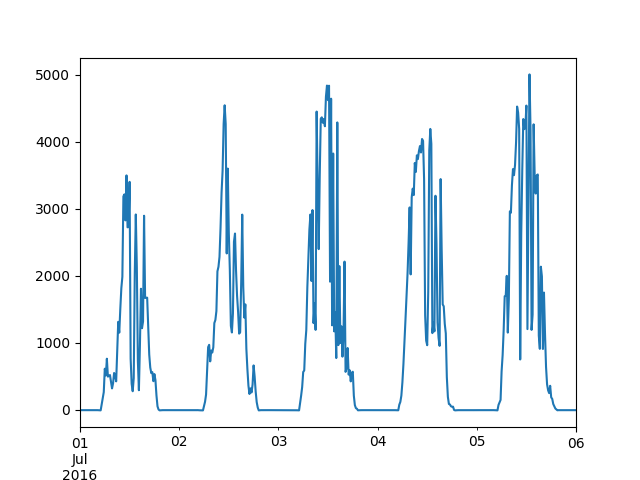
# Plot the first few days of the time series to visualize it
time_series[:pd.to_datetime("2016-07-06 00:00:00-07:00")].plot()
plt.show()

# Outline the ground truth metadata associated with the system
latitude = 39.742
longitude = -105.1727
actual_azimuth = 158
actual_tilt = 45

Next, we import the PSM3 data generated via the
pvlib.iotools.get_psm3() function, using
site latitude-longitude coordinates. To generate the
PSM3 data, you must first register for NREL’s NSDRB API at the
following link: https://developer.nrel.gov/signup/.
PSM3 data can then be retrieved using pvlib.iotools.get_psm3().
The PSM3 data has been resampled to 15 minute intervals, to match the AC
power data.
psm3_file = pvanalytics_dir / 'data' / 'serf_east_psm3_data.csv'
psm3 = pd.read_csv(psm3_file, index_col=0, parse_dates=True)
Filter the PSM3 data to only include clearsky periods
is_clear = (psm3.ghi_clear == psm3.ghi)
is_daytime = (psm3.ghi > 0)
time_series_clearsky = time_series[is_clear & is_daytime]
time_series_clearsky = time_series_clearsky.dropna()
psm3_clearsky = psm3.loc[time_series_clearsky.index]

# Get solar azimuth and zenith from pvlib, based on
# lat-long coords
solpos_clearsky = pvlib.solarposition.get_solarposition(
    time_series_clearsky.index, latitude, longitude)
Run the pvlib data and the sensor-based time series data through
the pvanalytics.system.infer_orientation_fit_pvwatts() function.
best_tilt, best_azimuth, r2 = system.infer_orientation_fit_pvwatts(
    time_series_clearsky,
    psm3_clearsky.ghi_clear,
    psm3_clearsky.dhi_clear,
    psm3_clearsky.dni_clear,
    solpos_clearsky.zenith,
    solpos_clearsky.azimuth,
    temperature=psm3_clearsky.temp_air,
)

# Compare actual system azimuth and tilt to predicted azimuth and tilt
print("Actual Azimuth: " + str(actual_azimuth))
print("Predicted Azimuth: " + str(best_azimuth))
print("Actual Tilt: " + str(actual_tilt))
print("Predicted Tilt: " + str(best_tilt))
Actual Azimuth: 158
Predicted Azimuth: 162.01767819075172
Actual Tilt: 45
Predicted Tilt: 42.14660650908418
Total running time of the script: (0 minutes 2.344 seconds)