Note
Go to the end to download the full example code
Flag Sunny Days for a Fixed-Tilt System#
Flag sunny days for a fixed-tilt PV system.
Identifying and masking sunny days for a fixed-tilt system is important when performing future analyses that require filtered sunny day data. For this example we will use data from the fixed-tilt NREL SERF East system located on the NREL campus in Colorado, USA, and generate a sunny day mask. This data set is publicly available via the PVDAQ database in the DOE Open Energy Data Initiative (OEDI) (https://data.openei.org/submissions/4568), as system ID 50. This data is timezone-localized.
import pvanalytics
from pvanalytics.features import daytime as day
from pvanalytics.features.orientation import fixed_nrel
import matplotlib.pyplot as plt
import pandas as pd
import pathlib
First, read in data from the NREL SERF East fixed-tilt system. This data set contains 15-minute interval AC power data.
pvanalytics_dir = pathlib.Path(pvanalytics.__file__).parent
file = pvanalytics_dir / 'data' / 'serf_east_15min_ac_power.csv'
data = pd.read_csv(file, index_col=0, parse_dates=True)
Mask day-night periods using the
pvanalytics.features.daytime.power_or_irradiance() function.
Then apply pvanalytics.features.orientation.fixed_nrel()
to the AC power stream and mask the sunny days in the time series.
daytime_mask = day.power_or_irradiance(data['ac_power'])

fixed_sunny_days = fixed_nrel(data['ac_power'],
                              daytime_mask)
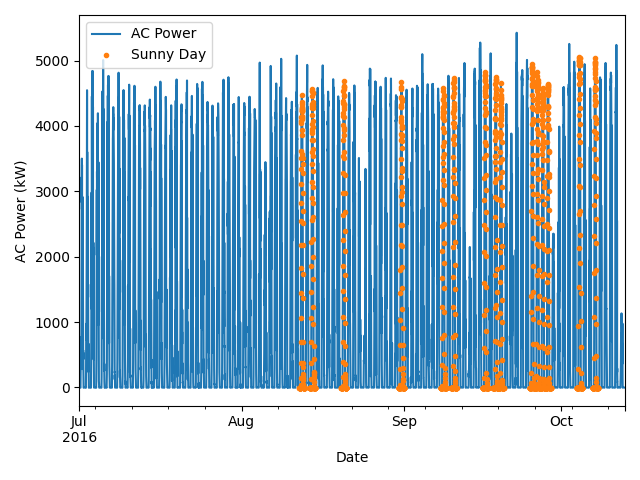
Plot the AC power stream with the sunny day mask applied to it.
data['ac_power'].plot()
data.loc[fixed_sunny_days, 'ac_power'].plot(ls='', marker='.')
plt.legend(labels=["AC Power", "Sunny Day"],
           loc="upper left")
plt.xlabel("Date")
plt.ylabel("AC Power (kW)")
plt.tight_layout()
plt.show()
Total running time of the script: (0 minutes 0.939 seconds)