Note
Go to the end to download the full example code
Data Shift Detection & Filtering#
Identifying data shifts/capacity changes in time series data
This example covers identifying data shifts/capacity changes in a time series
and extracting the longest time series segment free of these shifts, using
pvanalytics.quality.data_shifts.detect_data_shifts() and
pvanalytics.quality.data_shifts.get_longest_shift_segment_dates().
import pvanalytics
import pandas as pd
import matplotlib.pyplot as plt
from pvanalytics.quality import data_shifts as ds
import pathlib
As an example, we load in a simulated pvlib AC power time series with a single changepoint, occurring on October 28, 2015.
pvanalytics_dir = pathlib.Path(pvanalytics.__file__).parent
data_shift_file = pvanalytics_dir / 'data' / 'pvlib_data_shift.csv'
df = pd.read_csv(data_shift_file)
df.index = pd.to_datetime(df['timestamp'])
df['value'].plot()
print("Changepoint at: " + str(df[df['label'] == 1].index[0]))
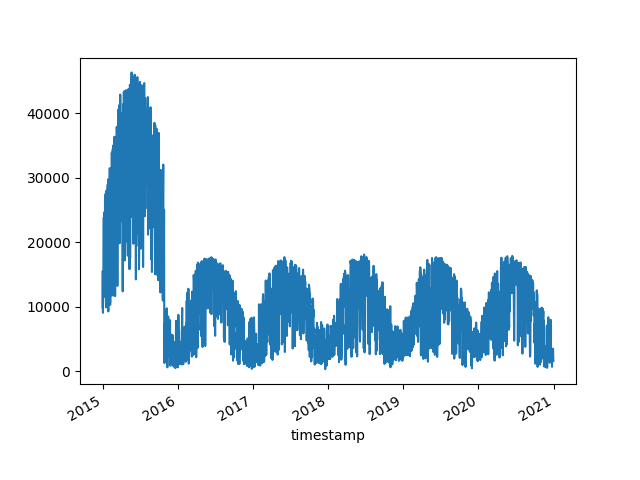
Changepoint at: 2015-10-28 00:00:00
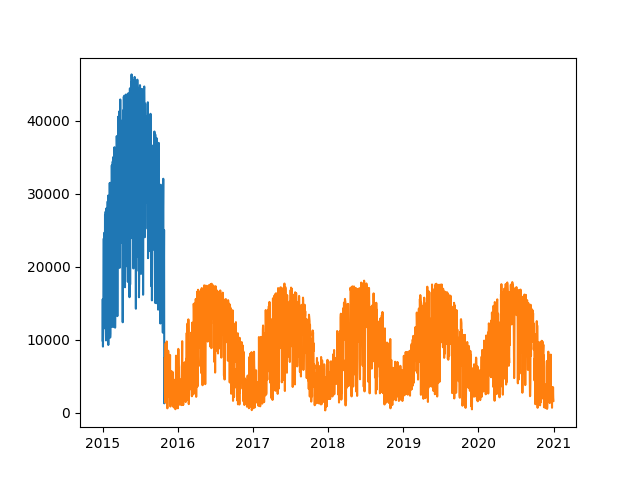
Now we run the data shift algorithm (with default parameters)
on the data stream, using
pvanalytics.quality.data_shifts.detect_data_shifts(). We plot the
predicted time series segments, based on algorithm results.
shift_mask = ds.detect_data_shifts(df['value'])
shift_list = list(df[shift_mask].index)
edges = [df.index[0]] + shift_list + [df.index[-1]]
fig, ax = plt.subplots()
for (st, ed) in zip(edges[:-1], edges[1:]):
ax.plot(df.loc[st:ed, "value"])
plt.show()
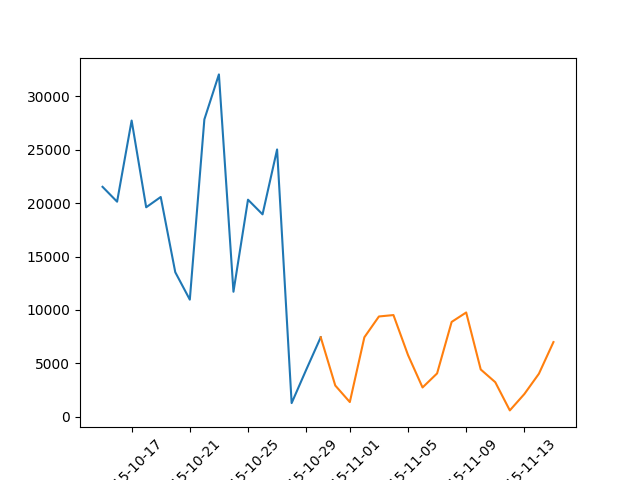
# We zoom in around the changepoint to more closely show the data shift. Time
# series segments pre- and post-shift are color-coded.
edges = [pd.to_datetime("10-15-2015")] + shift_list + \
[pd.to_datetime("11-15-2015")]
fig, ax = plt.subplots()
for (st, ed) in zip(edges[:-1], edges[1:]):
ax.plot(df.loc[st:ed, "value"])
plt.xticks(rotation=45)
plt.show()
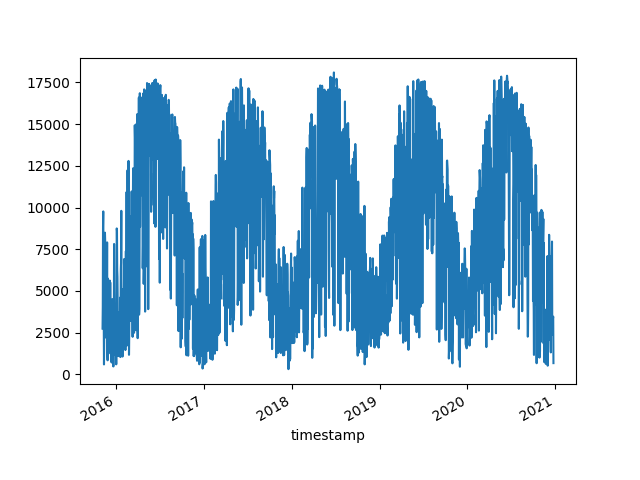
We filter the time series by the detected changepoints, taking the longest
continuous segment free of data shifts, using
pvanalytics.quality.data_shifts.get_longest_shift_segment_dates().
The trimmed time series is then plotted.
start_date, end_date = ds.get_longest_shift_segment_dates(df['value'])
df['value'][start_date:end_date].plot()
plt.show()
Total running time of the script: (0 minutes 1.093 seconds)