Note
Go to the end to download the full example code
Interpolated Data Periods#
Identifying periods in a time series where the data has been linearly interpolated.
Identifying periods where time series data has been linearly interpolated
and removing these periods may help to reduce noise when performing future
data analysis. This example shows how to use
pvanalytics.quality.gaps.interpolation_diff(), which identifies and
masks linearly interpolated periods.
import pvanalytics
from pvanalytics.quality import gaps
import matplotlib.pyplot as plt
import pandas as pd
import pathlib
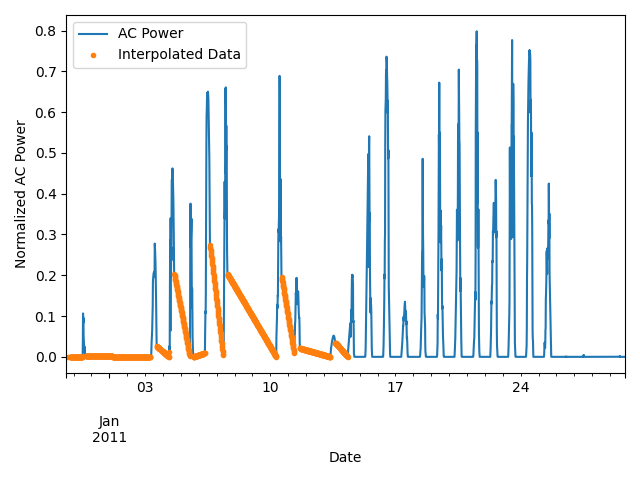
First, we import the AC power data stream that we are going to check for interpolated periods. The time series we download is a normalized AC power time series from the PV Fleets Initiative, and is available via the DuraMAT DataHub: https://datahub.duramat.org/dataset/inverter-clipping-ml-training-set-real-data. This data set has a Pandas DateTime index, with the min-max normalized AC power time series represented in the ‘value_normalized’ column. There is also an “interpolated_data_mask” column, where interpolated periods are labeled as True, and all other data is labeled as False. The data is sampled at 15-minute intervals.
pvanalytics_dir = pathlib.Path(pvanalytics.__file__).parent
file = pvanalytics_dir / 'data' / 'ac_power_inv_2173_interpolated_data.csv'
data = pd.read_csv(file, index_col=0, parse_dates=True)
data = data.asfreq("15T")
data['value_normalized'].plot()
data.loc[data["interpolated_data_mask"], "value_normalized"].plot(ls='',
                                                                  marker='.')
plt.legend(labels=["AC Power", "Interpolated Data"])
plt.xlabel("Date")
plt.ylabel("Normalized AC Power")
plt.tight_layout()
plt.show()
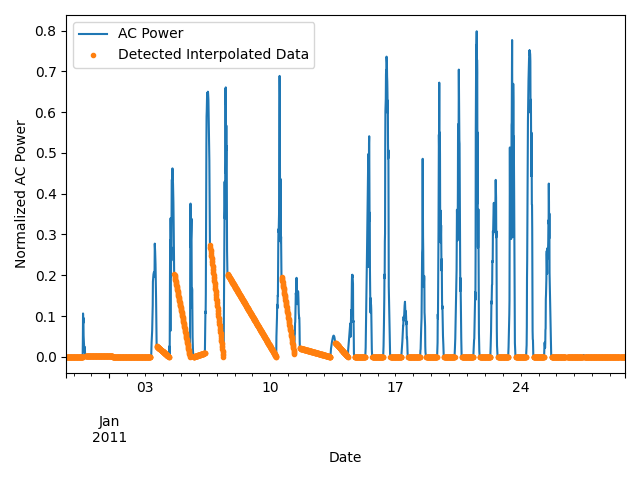
Now, we use pvanalytics.quality.gaps.interpolation_diff() to
identify linearly interpolated periods in the time series. We re-plot
the data with this mask. Please note that nighttime periods generally consist
of repeating 0 values; this means that these periods can be linearly
interpolated. Consequently, these periods are flagged by
pvanalytics.quality.gaps.interpolation_diff().
detected_interpolated_data_mask = gaps.interpolation_diff(
    data['value_normalized'])
data['value_normalized'].plot()
data.loc[detected_interpolated_data_mask,
         "value_normalized"].plot(ls='', marker='.')
plt.legend(labels=["AC Power", "Detected Interpolated Data"])
plt.xlabel("Date")
plt.ylabel("Normalized AC Power")
plt.tight_layout()
plt.show()
Total running time of the script: (0 minutes 0.843 seconds)