Note
Go to the end to download the full example code
Module Temperature Check#
Test whether the module temperature is correlated with irradiance.
Testing the correlation between module temperature and irradiance
measurements can help identify if there are issues with the module
temperature sensor.
In this example, we demonstrate how to use
pvanalytics.quality.weather.module_temperature_check(), which
runs a linear regression model of module temperature vs. irradiance. Model
performance is then assessed by the Pearson correlation coefficient.
If it meets a minimum threshold, function outputs a True boolean.
If not, it outputs a False boolean.
import pvanalytics
from pvanalytics.quality.weather import module_temperature_check
from pvanalytics.features.daytime import power_or_irradiance
import matplotlib.pyplot as plt
import pandas as pd
from scipy.stats import linregress
import pathlib
First, we read in example data from the NREL SERF West system, which contains data for module temperature and irradiance under the ‘module_temp_1__781’ and ‘poa_irradiance__771’ columns, respectively. This data set contains 15-minute averaged measurements, and is available via the NREL PVDAQ database as system 51.
pvanalytics_dir = pathlib.Path(pvanalytics.__file__).parent
serf_east_file = pvanalytics_dir / 'data' / 'serf_west_15min.csv'
data = pd.read_csv(serf_east_file, index_col=0, parse_dates=True)
print(data[['module_temp_1__781', 'poa_irradiance__771']].head(10))
                     module_temp_1__781  poa_irradiance__771
2022-01-02 00:01:00             -6.4187              -1.9775
2022-01-02 00:16:00             -6.2204              -2.0451
2022-01-02 00:31:00             -6.1505              -2.1464
2022-01-02 00:46:00             -5.9059              -2.1463
2022-01-02 01:01:00             -5.7022              -1.8083
2022-01-02 01:16:00             -5.4755              -1.9941
2022-01-02 01:31:00             -5.3714              -2.0109
2022-01-02 01:46:00             -4.4072              -1.7236
2022-01-02 02:01:00             -4.1609              -1.6221
2022-01-02 02:16:00             -3.9174              -1.6390
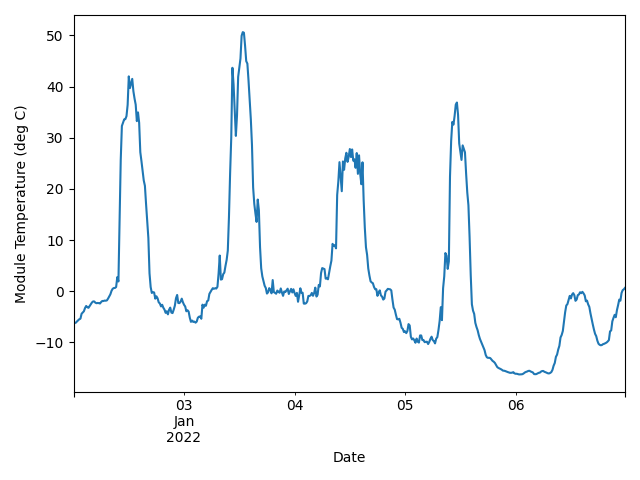
Plot the module temperature to visualize it.
data['module_temp_1__781'].plot()
plt.xlabel("Date")
plt.ylabel("Module Temperature (deg C)")
plt.xticks(rotation=25)
plt.tight_layout()
plt.show()
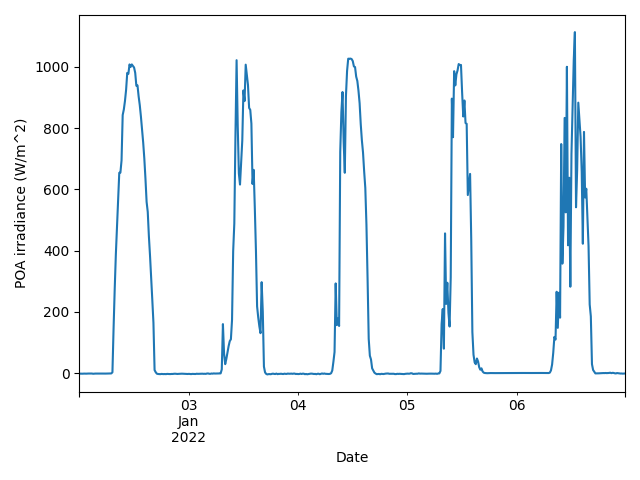
Plot the POA irradiance to visualize it.
data['poa_irradiance__771'].plot()
plt.xlabel("Date")
plt.ylabel("POA irradiance (W/m^2)")
plt.xticks(rotation=25)
plt.tight_layout()
plt.show()
We mask the irradiance time series into day-night periods, and remove any nighttime data to clean up the future regression.
predicted_day_night_mask = power_or_irradiance(
    series=data['poa_irradiance__771'], freq='15min')
# Filter out nighttime periods
data = data[predicted_day_night_mask]
We then use pvanalytics.quality.weather.module_temperature_check()
to regress module temperature against irradiance POA, and check if the
relationship meets the minimum correlation coefficient criteria.
Passes correlation coeff threshold? True
We then plot module temperature against irradiance to illustrate the relationship.
data.plot(x='module_temp_1__781',
          y='poa_irradiance__771',
          style='o', legend=None)
data_reg = data[['module_temp_1__781', 'poa_irradiance__771']].dropna()
# Add the linear regression line
reg = linregress(data_reg['module_temp_1__781'].values,
                 data_reg['poa_irradiance__771'].values)
plt.axline(xy1=(0, reg.intercept), slope=reg.slope, linestyle="--", color="k")
plt.xlabel("Module Temperature (deg C)")
plt.ylabel("POA irradiance (W/m^2)")
plt.xticks(rotation=25)
plt.tight_layout()
plt.show()

# Print the Pearson correlation coefficient associated with the regression.
print("Pearson Correlation Coefficient: ")
print(reg.rvalue)
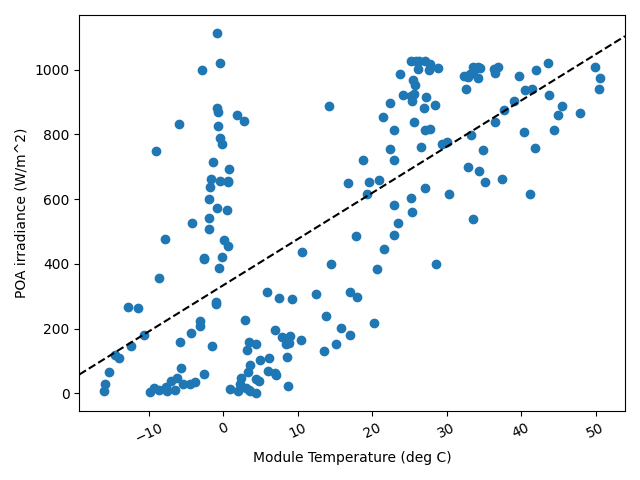
Pearson Correlation Coefficient:
0.6836377995026489
Total running time of the script: (0 minutes 0.554 seconds)