Note
Go to the end to download the full example code
Stale Data Periods#
Identifying stale data periods in a time series.
Identifing and removing stale, or consecutive repeating, values in time
series data reduces noise when performing data analysis. This example shows
how to use two PVAnalytics functions,
pvanalytics.quality.gaps.stale_values_diff()
and pvanalytics.quality.gaps.stale_values_round(), to identify
and mask stale data periods in time series data.
import pvanalytics
from pvanalytics.quality import gaps
import matplotlib.pyplot as plt
import pandas as pd
import pathlib
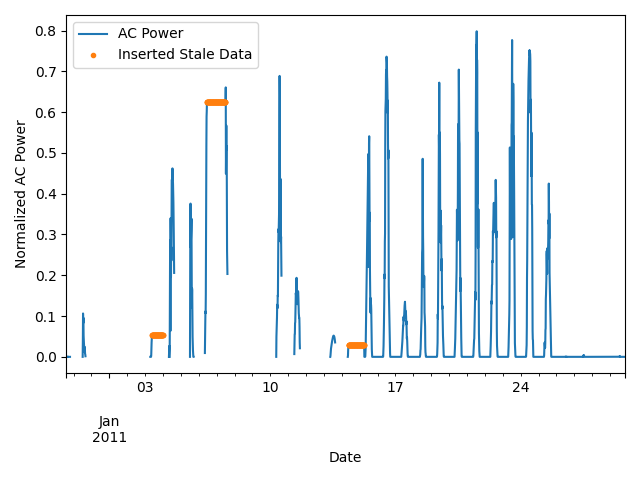
First, we import the AC power data stream that we are going to check for stale data periods. The time series we download is a normalized AC power time series from the PV Fleets Initiative, and is available via the DuraMAT DataHub: https://datahub.duramat.org/dataset/inverter-clipping-ml-training-set-real-data This data set has a Pandas DateTime index, with the min-max normalized AC power time series represented in the ‘value_normalized’ column. Additionally, there is a “stale_data_mask” column, where stale periods are labeled as True, and all other data is labeled as False. The data is sampled at 15-minute intervals.
pvanalytics_dir = pathlib.Path(pvanalytics.__file__).parent
file = pvanalytics_dir / 'data' / 'ac_power_inv_2173_stale_data.csv'
data = pd.read_csv(file, index_col=0, parse_dates=True)
data = data.asfreq("15min")
data['value_normalized'].plot()
data.loc[data["stale_data_mask"], "value_normalized"].plot(ls='', marker='.')
plt.legend(labels=["AC Power", "Inserted Stale Data"])
plt.xlabel("Date")
plt.ylabel("Normalized AC Power")
plt.tight_layout()
plt.show()
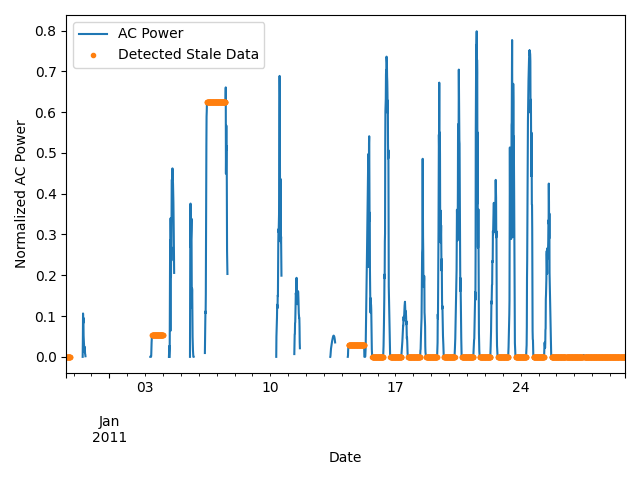
Now, we use pvanalytics.quality.gaps.stale_values_diff() to
identify stale values in data. We visualize the detected stale periods
graphically. Please note that nighttime periods generally contain consecutive
repeating 0 values, which are flagged by
pvanalytics.quality.gaps.stale_values_diff().
stale_data_mask = gaps.stale_values_diff(data['value_normalized'])
data['value_normalized'].plot()
data.loc[stale_data_mask, "value_normalized"].plot(ls='', marker='.')
plt.legend(labels=["AC Power", "Detected Stale Data"])
plt.xlabel("Date")
plt.ylabel("Normalized AC Power")
plt.tight_layout()
plt.show()

Now, we use pvanalytics.quality.gaps.stale_values_round() to
identify stale values in data, using rounded data. This function yields
similar results as pvanalytics.quality.gaps.stale_values_diff(),
except it looks for consecutive repeating data that has been rounded to
a settable decimals place.
Please note that nighttime periods generally
contain consecutive repeating 0 values, which are flagged by
pvanalytics.quality.gaps.stale_values_round().
stale_data_round_mask = gaps.stale_values_round(data['value_normalized'])
data['value_normalized'].plot()
data.loc[stale_data_round_mask, "value_normalized"].plot(ls='', marker='.')
plt.legend(labels=["AC Power", "Detected Stale Data"])
plt.xlabel("Date")
plt.ylabel("Normalized AC Power")
plt.tight_layout()
plt.show()
Total running time of the script: (0 minutes 1.139 seconds)