Note
Go to the end to download the full example code
Calculate Performance Ratio (NREL)#
Calculate the NREL Performance Ratio for a system.
When evaluating PV system performance it is often desirable to distinguish
uncontrollable effects like weather variation from controllable effects
like soiling and hardware issues. The NREL Performance Ratio
(or “Weather-Corrected Performance Ratio”) is a unitless metric that
normalizes system output for variation in irradiance and temperature,
making it insensitive to uncontrollable weather variation and more
reflective of system health. In this example, we
show how to calculate the NREL PR at two different frequencies: for a
complete time series, and at daily intervals. We use the
pvanalytics.metrics.performance_ratio_nrel() function.
import pvanalytics
from pvanalytics.metrics import performance_ratio_nrel
import pandas as pd
import pathlib
import matplotlib.pyplot as plt
First, we read in data from the NREL RSF II system. This data set contains 15-minute interval data for AC power, POA irradiance, ambient temperature, and wind speed, among others. The complete data set for the NREL RSF II installation is available in the PVDAQ database, under system ID 1283.
pvanalytics_dir = pathlib.Path(pvanalytics.__file__).parent
file = pvanalytics_dir / 'data' / 'nrel_RSF_II.csv'
data = pd.read_csv(file, index_col=0, parse_dates=True)
Now we calculate the PR for the entire time series, using the
POA, ambient temperature, wind speed, and AC power fields. We use this
data as parameters in the
pvanalytics.metrics.performance_ratio_nrel() function.
In this example we are calculating PR for a single inverter connected
to a 204.12 kW PV array.
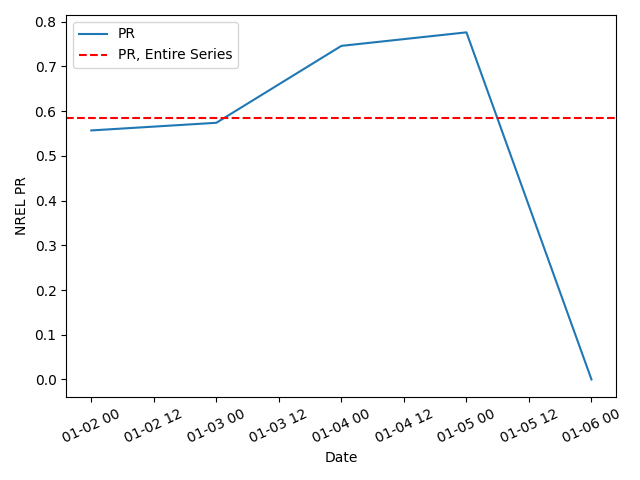
RSF II, PR for the whole time series:
0.5851958594021633
Next, we recalculate the PR on a daily basis. We separate the time series into daily intervals, and calculate the PR for each day. Note that this inverter was offline for the last day in this dataset, resulting in a PR value of zero for that day.
dates = list(pd.Series(data.index.date).drop_duplicates())

daily_pr_list = list()
for date in dates:
    data_subset = data[data.index.date == date]
    # Run the PR calculation for the specific day.
    pr = performance_ratio_nrel(data_subset['poa_irradiance__1055'],
                                data_subset['ambient_temp__1053'],
                                data_subset['wind_speed__1051'],
                                data_subset['inv2_ac_power_w__1047']/1000,
                                204.12)
    daily_pr_list.append({"date": date,
                          "PR": pr})

daily_pr_df = pd.DataFrame(daily_pr_list)

# Plot the PR time series to visualize it
daily_pr_df.set_index('date').plot()
plt.axhline(pr_whole_series, color='r', ls='--', label='PR, Entire Series')
plt.xticks(rotation=25)
plt.legend()
plt.ylabel('NREL PR')
plt.xlabel('Date')
plt.tight_layout()
plt.show()
Total running time of the script: (0 minutes 0.282 seconds)