Note
Go to the end to download the full example code
Z-Score Outlier Detection#
Identifying outliers in time series using z-score outlier detection.
Identifying and removing outliers from PV sensor time series
data allows for more accurate data analysis.
In this example, we demonstrate how to use
pvanalytics.quality.outliers.zscore() to identify and filter
out outliers in a time series.
import pvanalytics
from pvanalytics.quality.outliers import zscore
import matplotlib.pyplot as plt
import pandas as pd
import pathlib
First, we read in the ac_power_inv_7539_outliers example. Min-max normalized AC power is represented by the “value_normalized” column. There is a boolean column “outlier” where inserted outliers are labeled as True, and all other values are labeled as False. These outlier values were inserted manually into the data set to illustrate outlier detection by each of the functions. We use a normalized time series example provided by the PV Fleets Initiative. This example is adapted from the DuraMAT DataHub clipping data set: https://datahub.duramat.org/dataset/inverter-clipping-ml-training-set-real-data
pvanalytics_dir = pathlib.Path(pvanalytics.__file__).parent
ac_power_file = pvanalytics_dir / 'data' / 'ac_power_inv_7539_outliers.csv'
data = pd.read_csv(ac_power_file, index_col=0, parse_dates=True)
print(data.head(10))
                           value_normalized  outlier
timestamp
2017-04-10 19:15:00+00:00          0.000002    False
2017-04-10 19:30:00+00:00          0.000000    False
2017-04-11 06:15:00+00:00          0.000000    False
2017-04-11 06:45:00+00:00          0.033103    False
2017-04-11 07:00:00+00:00          0.043992    False
2017-04-11 07:15:00+00:00          0.055615    False
2017-04-11 07:30:00+00:00          0.110986    False
2017-04-11 07:45:00+00:00          0.184948    False
2017-04-11 08:00:00+00:00          0.276810    False
2017-04-11 08:15:00+00:00          0.358061    False
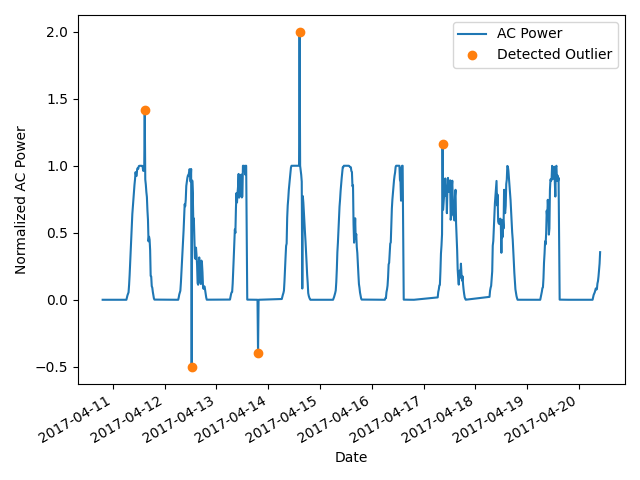
We then use pvanalytics.quality.outliers.zscore() to identify
outliers in the time series, and plot the data with the z-score outlier mask.
zscore_outlier_mask = zscore(data=data['value_normalized'])
data['value_normalized'].plot()
data.loc[zscore_outlier_mask, 'value_normalized'].plot(ls='', marker='o')
plt.legend(labels=["AC Power", "Detected Outlier"])
plt.xlabel("Date")
plt.ylabel("Normalized AC Power")
plt.tight_layout()
plt.show()
Total running time of the script: (0 minutes 0.221 seconds)