Note
Go to the end to download the full example code.
Day-Night Masking#
Masking day-night periods using the PVAnalytics daytime module.
Identifying and masking day-night periods in an AC power time series or
irradiance time series can aid in future data analysis, such as detecting
if a time series has daylight savings time or time shifts. Here, we use
pvanalytics.features.daytime.power_or_irradiance() to mask day/night
periods, as well as to estimate sunrise and sunset times in the data set.
This function is particularly useful for cases where the time zone of a data
stream is unknown or incorrect, as its outputs can be used to determine time
zone.
import pvanalytics
from pvanalytics.features.daytime import power_or_irradiance
import matplotlib.pyplot as plt
import pandas as pd
import pathlib
import pvlib
import numpy as np
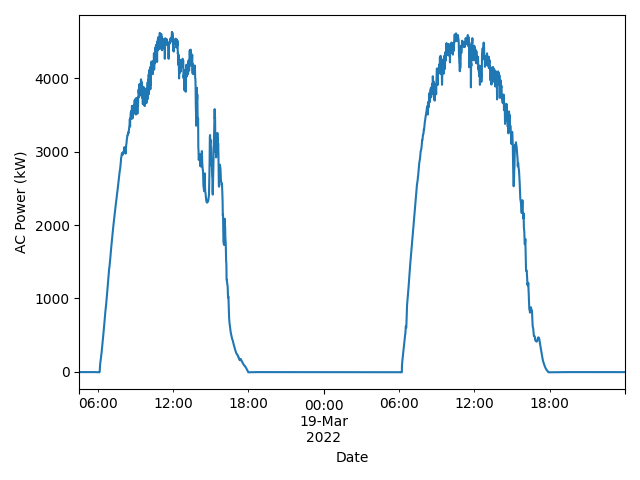
First, read in the 1-minute sampled AC power time series data, taken from the SERF East installation on the NREL campus. This sample is provided from the NREL PVDAQ database, and contains a column representing an AC power data stream.
pvanalytics_dir = pathlib.Path(pvanalytics.__file__).parent
ac_power_file = pvanalytics_dir / 'data' / 'serf_east_1min_ac_power.csv'
data = pd.read_csv(ac_power_file, index_col=0, parse_dates=True)
data = data.sort_index()

# This is the known frequency of the time series. You may need to infer
# the frequency or set the frequency with your AC power time series.
freq = "1min"
# These are the latitude-longitude coordinates associated with the
# SERF East system.
latitude = 39.742
longitude = -105.173
# Plot the time series.
data['ac_power__752'].plot()
plt.xlabel("Date")
plt.ylabel("AC Power (kW)")
plt.tight_layout()
plt.show()
It is critical to set all negative values in the AC power time series to 0
for pvanalytics.features.daytime.power_or_irradiance() to work
properly. Negative erroneous data may affect daytime mask assignments.
Now, use pvanalytics.features.daytime.power_or_irradiance()
to mask day periods in the time series.
predicted_day_night_mask = power_or_irradiance(series=data['ac_power__752'],
                                               freq=freq)
Function pvlib.solarposition.sun_rise_set_transit_spa() is
used to get ground-truth sunrise and sunset times for each day at the site
location, and a SPA-daytime mask is calculated based on these times. Data
associated with SPA daytime periods is labeled as True, and data associated
with SPA nighttime periods is labeled as False.
SPA sunrise and sunset times are used here as a point of comparison to the
pvanalytics.features.daytime.power_or_irradiance() outputs.
SPA-based sunrise and sunset values are not
needed to run pvanalytics.features.daytime.power_or_irradiance().
sunrise_sunset_df = pvlib.solarposition.sun_rise_set_transit_spa(data.index,
                                                                 latitude,
                                                                 longitude)
data['sunrise_time'] = sunrise_sunset_df['sunrise']
data['sunset_time'] = sunrise_sunset_df['sunset']

data['daytime_mask'] = True
data.loc[(data.index < data.sunrise_time) |
         (data.index > data.sunset_time), "daytime_mask"] = False
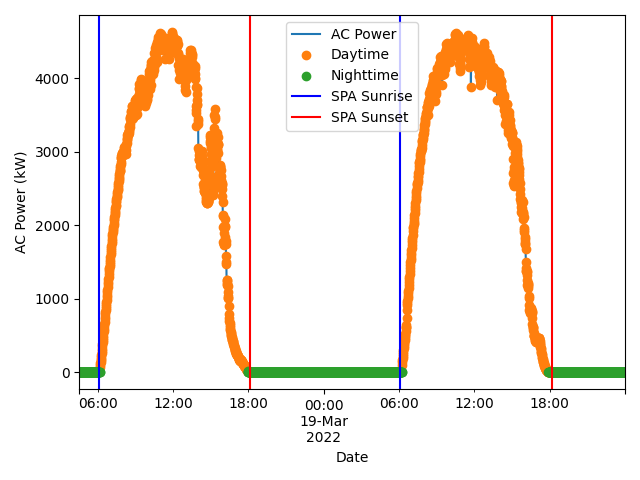
Plot the AC power data stream with the mask output from
pvanalytics.features.daytime.power_or_irradiance(),
as well as the SPA-calculated sunrise and sunset
data['ac_power__752'].plot()
data.loc[predicted_day_night_mask, 'ac_power__752'].plot(ls='', marker='o')
data.loc[~predicted_day_night_mask, 'ac_power__752'].plot(ls='', marker='o')
sunrise_sunset_times = sunrise_sunset_df[['sunrise',
                                          'sunset']].drop_duplicates()
for sunrise, sunset in sunrise_sunset_times.itertuples(index=False):
    plt.axvline(x=sunrise, c="blue")
    plt.axvline(x=sunset, c="red")
plt.legend(labels=["AC Power", "Daytime", "Nighttime",
                   "SPA Sunrise", "SPA Sunset"])
plt.xlabel("Date")
plt.ylabel("AC Power (kW)")
plt.tight_layout()
plt.show()
Compare the predicted mask to the ground-truth SPA mask, to get the model accuracy. Also, compare sunrise and sunset times for the predicted mask compared to the ground truth sunrise and sunset times.
acc = 100 * np.sum(np.equal(data.daytime_mask,
                            predicted_day_night_mask))/len(data.daytime_mask)
print("Overall model prediction accuracy: " + str(round(acc, 2)) + "%")

# Generate predicted + SPA sunrise times for each day
print("Sunrise Comparison:")
print(pd.DataFrame({'predicted_sunrise': predicted_day_night_mask
                    .index[predicted_day_night_mask]
                    .to_series().resample("d").first(),
                    'pvlib_spa_sunrise': sunrise_sunset_df["sunrise"]
                    .resample("d").first()}))
# Generate predicted + SPA sunset times for each day
print("Sunset Comparison:")
print(pd.DataFrame({'predicted_sunset': predicted_day_night_mask
                    .index[predicted_day_night_mask]
                    .to_series().resample("d").last(),
                    'pvlib_spa_sunset': sunrise_sunset_df["sunrise"]
                    .resample("d").last()}))
Overall model prediction accuracy: 95.36%
Sunrise Comparison:
                                  predicted_sunrise                   pvlib_spa_sunrise
measured_on
2022-03-18 00:00:00-07:00 2022-03-18 06:11:00-07:00    2022-03-18 06:07:09.226592-07:00
2022-03-19 00:00:00-07:00 2022-03-19 06:14:00-07:00 2022-03-19 06:05:32.867153920-07:00
Sunset Comparison:
                                   predicted_sunset                    pvlib_spa_sunset
measured_on
2022-03-18 00:00:00-07:00 2022-03-18 17:56:00-07:00 2022-03-19 06:05:32.867153920-07:00
2022-03-19 00:00:00-07:00 2022-03-19 17:52:00-07:00 2022-03-20 06:03:56.379928064-07:00
Total running time of the script: (0 minutes 0.598 seconds)