Note
Go to the end to download the full example code.
Clear-Sky Detection#
Identifying periods of clear-sky conditions using measured irradiance.
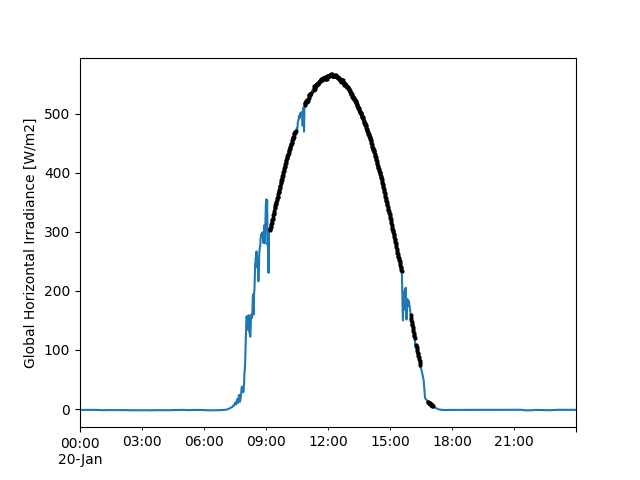
Identifying and filtering for clear-sky conditions is a useful way to
reduce noise when analyzing measured data. This example shows how to
use pvanalytics.features.clearsky.reno() to identify clear-sky
conditions using measured GHI data. For this example we’ll use
GHI measurements from NREL in Golden CO.
import pvanalytics
from pvanalytics.features.clearsky import reno
import pvlib
import matplotlib.pyplot as plt
import pandas as pd
import pathlib
First, read in the GHI measurements. For this example we’ll use an example file included in pvanalytics covering a single day, but the same process applies to data of any length.
pvanalytics_dir = pathlib.Path(pvanalytics.__file__).parent
ghi_file = pvanalytics_dir / 'data' / 'midc_bms_ghi_20220120.csv'
data = pd.read_csv(ghi_file, index_col=0, parse_dates=True)

# or you can fetch the data straight from the source using pvlib:
# date = pd.to_datetime('2022-01-20')
# data = pvlib.iotools.read_midc_raw_data_from_nrel('BMS', date, date)

measured_ghi = data['Global CMP22 (vent/cor) [W/m^2]']
Now model clear-sky irradiance for the location and times of the measured data:
location = pvlib.location.Location(39.742, -105.18)
clearsky = location.get_clearsky(data.index)
clearsky_ghi = clearsky['ghi']
Finally, use pvanalytics.features.clearsky.reno() to identify
measurements during clear-sky conditions:
is_clearsky = reno(measured_ghi, clearsky_ghi)

# clear-sky times indicated in black
measured_ghi.plot()
measured_ghi[is_clearsky].plot(ls='', marker='o', ms=2, c='k')
plt.ylabel('Global Horizontal Irradiance [W/m2]')
plt.show()
Total running time of the script: (0 minutes 0.149 seconds)