Example Gallery#
This gallery shows examples of pvanalytics functionality. Community contributions are welcome!
Clearsky Detection#
This includes examples for identifying clearsky periods in time series data.
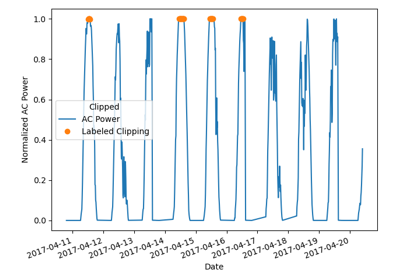
Clipping#
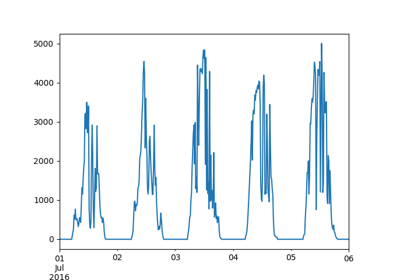
This includes examples for identifying clipping in AC power time series.
Day-Night Masking#
This includes examples for identifying day-night periods in time series data.
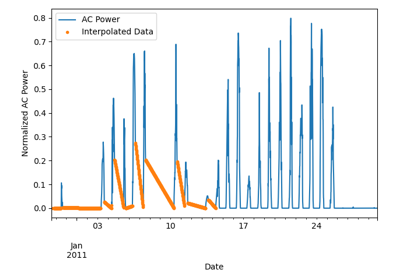
Gaps#
This includes examples for identifying gaps and other related issues in time series data, including interpolated periods and stale data periods.

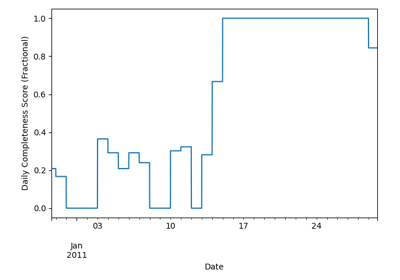
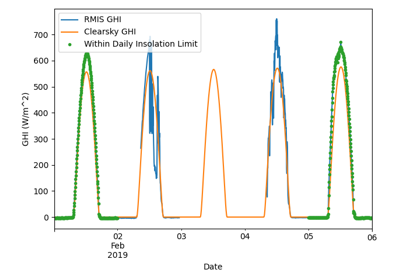
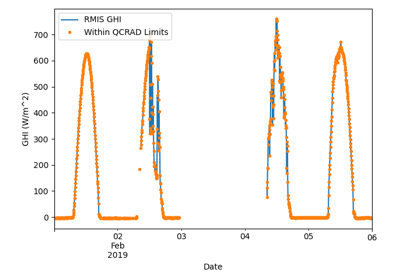
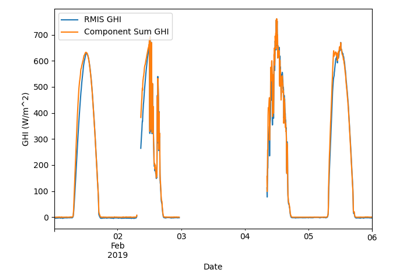
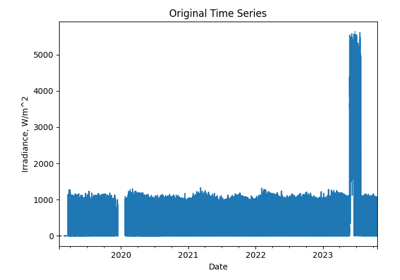
Irradiance-Quality#
This includes examples for running irradiance quality checks on irradiance time series data.

Metrics#
This includes examples for quantifying system time series metrics, including variability index (VI) and NREL performance ratio (PR).


Orientation#
This includes examples related to the orientation of a system (fixed-tilt, tracking).

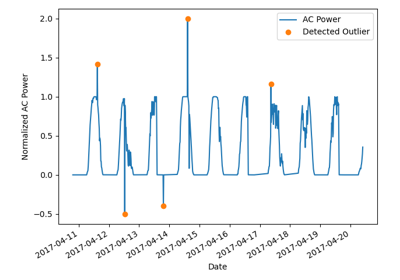
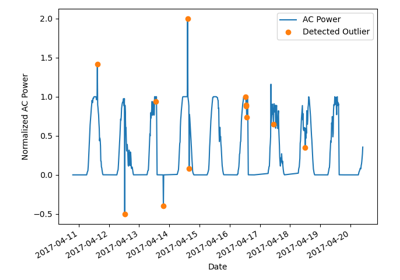
Outliers#
This includes examples for identifying outliers in time series data.

PVFleets QA Examples#
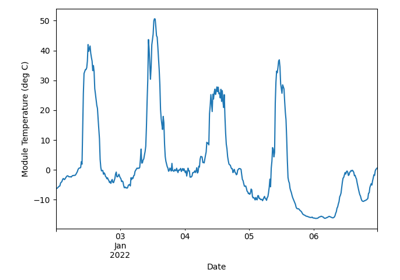
These examples highlight the QA processes for temperature, power and irradiance data streams that are used in the NREL PV Fleet Performance Data Initiative (https://www.nrel.gov/pv/fleet-performance-data-initiative.html).


Data/Time Shifts#
This includes examples for identifying data/capacity/time shifts in time series data.

Snow#
Examples for identifying the effects of snow.

System#
This includes examples for system parameter estimation, including azimuth and tilt estimation, and determination if the system is fixed tilt or tracking.
Weather#
This includes examples for weather quality checks.